Hi all. I’m not really a ruby programmer, but I can hack some python and shell scripting. I took a user count cron job that they use on Mastodon and ported it to work with my Diaspora pod. If you look at the main page at my pod (a.grumpy.world) you’ll see the pod statistics at the bottom. Here’s the graph. 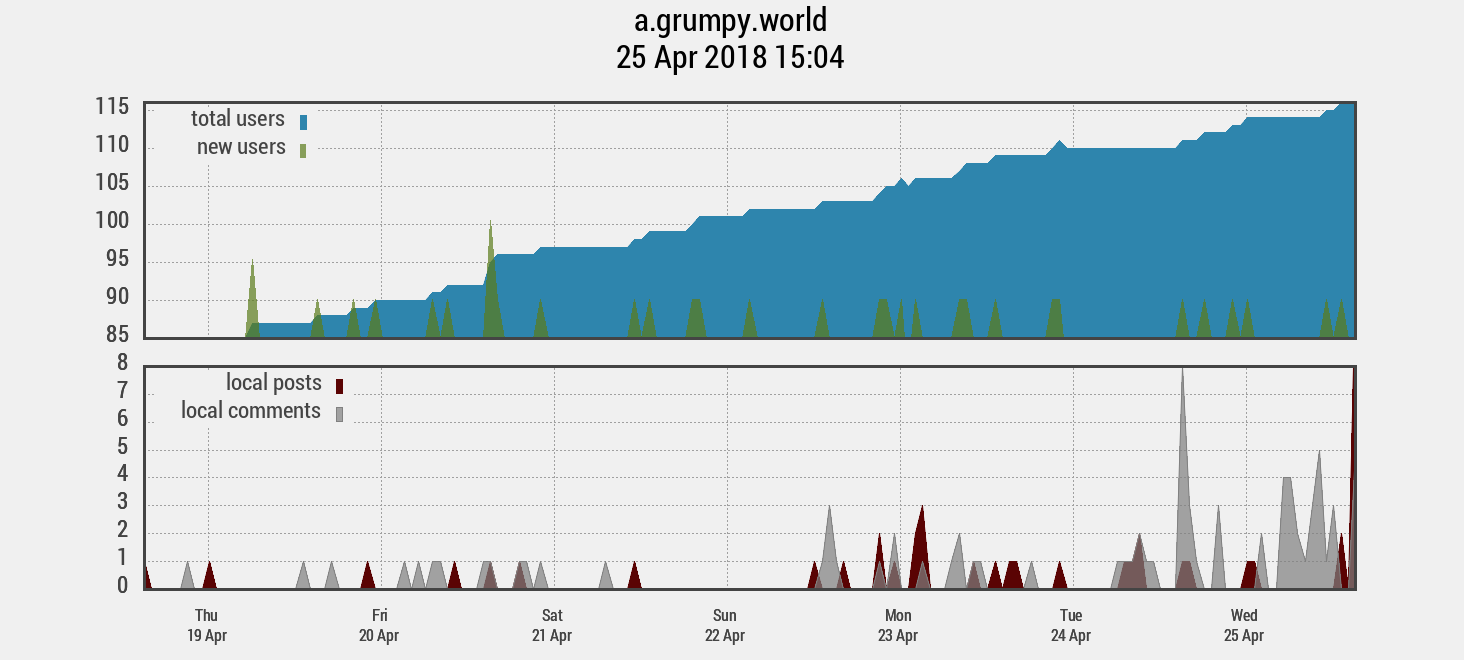
You can see the original over at mastodon.social. That gives you a sense of what this looks like after it has been running a while. The code is available on my github.
It’s a bit of a hack. It basically involves running a python program once per hour that does 2 simple postgres queries. It pulls the current count of non-deleted users and the current count of local posts. It calculates some rates and stuff and then plots the graph using gnuplot. There might be simpler ways to pull that data. It is also making a non-decreasing CSV file (24 lines per day) which seems like it isn’t a scalable way to do things forever.
The way I get it onto the main page of my pod is also a hack. I’m open to better suggestions. Enjoy.